Design of a Thrilling Roller Coaster
 |
 |
|
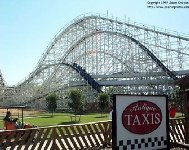
Texas Cyclone, Houston, TX |
|
For the Instructor
 |
|
Colossus |
The thrill of a drop is the product of the angle of steepest descent in the drop (in radians) and the total vertical distance in the drop. The thrill of the coaster is the sum of the thrills of each drop.
|
Roller Coaster Restrictions |
|
 |
|
Steel Dragon 2000 |
To complete this project, you must complete Module A (next page) and as many of the Modules B through E as your instructor chooses to assign. You will then be ready to tackle Module F.
| Trish Hammer is in the Department of Mathematics and Statistics at Hollins University. Jessica King is a 2004 graduate of Hollins University with a degree in Computer Science. Steve Hammer is in the Department of Mathematics at Virginia Western Community College. |
All roller coaster images on these pages are used with permission of their respective copyright holders. Sources:
- Colossus from UltimateRollercoaster.com, © 1997, Ultimate Rollercoaster
- Greyhound and The Devil from Ken's Classic Coaster Postcards, © 1998-2003, Ken Rutherford
- Steel Dragon and Shivering Timbers from CoasterGallery.com, © 2000-2004, Jeff Rogers
- Texas Cyclone from Coasterphotos.com, © 1999, Jason Knudson
Published February, 2005
Design of a Thrilling Roller Coaster - Introduction to the Project
|
|
|
Texas Cyclone, Houston, TX |
|
For the Instructor
|
|
Colossus |
The thrill of a drop is the product of the angle of steepest descent in the drop (in radians) and the total vertical distance in the drop. The thrill of the coaster is the sum of the thrills of each drop.
|
Roller Coaster Restrictions |
|
|
|
Steel Dragon 2000 |
To complete this project, you must complete Module A (next page) and as many of the Modules B through E as your instructor chooses to assign. You will then be ready to tackle Module F.
| Trish Hammer is in the Department of Mathematics and Statistics at Hollins University. Jessica King is a 2004 graduate of Hollins University with a degree in Computer Science. Steve Hammer is in the Department of Mathematics at Virginia Western Community College. |
All roller coaster images on these pages are used with permission of their respective copyright holders. Sources:
- Colossus from UltimateRollercoaster.com, © 1997, Ultimate Rollercoaster
- Greyhound and The Devil from Ken's Classic Coaster Postcards, © 1998-2003, Ken Rutherford
- Steel Dragon and Shivering Timbers from CoasterGallery.com, © 2000-2004, Jeff Rogers
- Texas Cyclone from Coasterphotos.com, © 1999, Jason Knudson
Published February, 2005
Design of a Thrilling Roller Coaster - Module A. Introduction to Roller Coaster Design
In this module, you will use the interactive coaster window to mark peak and valley points of the indicated straight stretch portions of the real-life roller coasters. Cubic polynomials are automatically drawn to connect successive peak/valley points. Coordinates of the marked points are shown, as well as the slope value at the point of steepest descent/ascent of the cubic polynomial path. You can use this information to calculate the thrill of each drop according to the definition:
The thrill of a drop is the product of the angle of steepest descent in the drop (in radians) and the total vertical distance in the drop. The thrill of the coaster is the sum of the thrills of each drop.
Be sure to record the x and y coordinates of the peak and valley points and the slope at the steepest point. You will need this information to complete parts B - E.
Assignment
For Colossus and Steel Dragon
-
Point and click to mark the peak and valley point of the indicated drop. Choose peak and valley points so that the connecting cubic polynomial provides a close fit to the actual path of the coaster.
-
What is the minimum value of the slope along your path?
-
What is the angle of steepest descent along your path?
-
What is the vertical drop of your path?
-
What is the thrill of your path?
 |
|
The Devil |
-
Point and click to mark peak and valley points along the indicated path of the coaster. Choose peak and valley points so that the connecting polynomials provide a close fit to the actual path of the coaster.
-
What is the minimum (maximum) value of the slope along each fall (rise) of your path?
-
What is the angle of steepest descent (ascent) along each fall (rise) of your path?
-
What is the vertical drop of each fall of your path?
-
What is the thrill of your path?
Design of a Thrilling Roller Coaster - Module B. Design of One Drop: Trig Function
In this module, you will model one drop of a coaster by marking the peak and valley of the drop and then fitting (in height and slope) a trig function of the form
f(x) = A cos(Bx + C) + D
to the marked points. Once you have determined the function, you will then calculate the thrill of the single drop. We provide a downloadable Maple worksheet with commands and explanations.
I. Getting Started
![]() Click the button at the right to open the MAPLE worksheet trigcoaster1hill.mws. If you are given a choice, you should save the file to your hard drive, then navigate to your hard drive and open the file from there. In the MAPLE worksheet, position your cursor anywhere in the line [ > restart: and press Enter. Pressing the Enter key executes the MAPLE code on the current line. The MAPLE restart command will clear all MAPLE variables. It is important to do this whenever you start a new MAPLE project.
Click the button at the right to open the MAPLE worksheet trigcoaster1hill.mws. If you are given a choice, you should save the file to your hard drive, then navigate to your hard drive and open the file from there. In the MAPLE worksheet, position your cursor anywhere in the line [ > restart: and press Enter. Pressing the Enter key executes the MAPLE code on the current line. The MAPLE restart command will clear all MAPLE variables. It is important to do this whenever you start a new MAPLE project.
Now resize your MAPLE and Internet Explorer windows so that you can see them both, side-by-side. Click in either window to make it the active window.
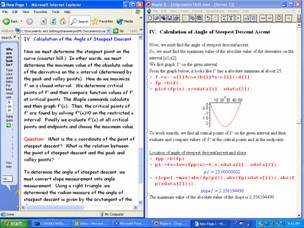
Your screen should look something like the figure at the right.
II. Data Points
First, carefully work through this module using the sample peak and valley points already entered in the Maple worksheet. Then, use your recorded peak and valley data points collected from Colossus (Module A, page 2).
Enter the x coordinates of your peak point and valley point using the list syntax ( [x1,x2] ) for the xdata variable.
Enter the y coordinates of your peak point and valley point using the list syntax ( [y1,y2] )for the ydata variable.
Enter the slope conditions for your peak point and for your valley point using the list syntax ( [s1,s2] ) for the slopes variable.
III. Connecting Trig Function
Now that you have entered the x coordinates, y coordinates, and slope conditions, you can work through the Maple worksheet by pressing the Enter key on your computer to execute the Maple commands.
In this section, the Maple commands will determine a trig function of the form
f(x) = A cos(Bx + C) + D
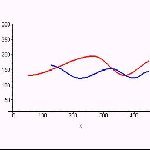
that fits the given peak and valley points. A close examination of the commands shows that Maple determines the unknown coefficients by solving a system of 4 equations [two conditions at each of the two (peak and valley) points] in 4 unknowns. Moreover, the coefficient B can be determined by requiring the period of the trig function to be twice the distance between peak and valley points.
Maple shows a plot of the trig function. Does this match your coaster hill?
IV. Calculation of the Angle of Steepest Descent
Now we must determine the steepest point on the curve (i.e., the coaster drop). In other words, we must determine the minimum value of the derivative on the x interval (determined by the peak and valley points). In order to work with a positive-valued function, we rephrase this as determining the maximum value of the absolute value of the derivative on the x interval.
How do we maximize |f'| on a closed interval? We determine critical points of f' and then compare function values of f' at critical points and endpoints. The Maple commands calculate and then graph f'(x). Then, the critical points of f' are found by solving f"(x) = 0 on the restricted x interval. Finally, we evaluate f'(x) at all critical points and endpoints and choose the maximum absolute value.
Questions:
-
What is the x coordinate of the point of steepest descent?
-
What is the relation between the point of steepest descent and the peak and valley points?
-
Is this relation true for all functions?
-
How does the slope at the steepest point compare to your previous work from module A?
To determine the angle of steepest descent, we must convert slope measurement into angle measurement. Using a right triangle, we see that the radian measure of the angle of steepest descent is given by the arctangent of the slope.
V. Safety Restrictions and Thrill Factor
In this section, we determine safety of the coaster based on the radian measure of the angle of steepest descent. We also calculate the thrill of the drop, based on the definition (see page 1 or page 2).
VI. Observation and Generalization
Repeat using collected data points (from Module A, page 2) for the single drop of the Steel Dragon.
Keeping in mind the coaster restrictions, experiment with several different peak and valley combinations. Keep a record of your results.
Design of a Thrilling Roller Coaster - Module C. Design of One Drop: Polynomial Function
In this module, you will model one drop of a coaster by marking the peak and valley of the drop and then fitting (in height and slope) a cubic polynomial to the marked points. Once you have determined the function, you will then calculate the thrill of the single drop. We provide a downloadable Maple worksheet with commands and explanations.
I. Getting Started
![]() Click the button at the right to open the MAPLE worksheet cubiccoaster1hill.mws. If you are given a choice, you should save the file to your hard drive, then navigate to your hard drive and open the file from there. In the MAPLE worksheet, position your cursor anywhere in the line [ > restart: and press Enter. Pressing the Enter key executes the MAPLE code on the current line. The MAPLE restart command will clear all MAPLE variables. It is important to do this whenever you start a new MAPLE project.
Click the button at the right to open the MAPLE worksheet cubiccoaster1hill.mws. If you are given a choice, you should save the file to your hard drive, then navigate to your hard drive and open the file from there. In the MAPLE worksheet, position your cursor anywhere in the line [ > restart: and press Enter. Pressing the Enter key executes the MAPLE code on the current line. The MAPLE restart command will clear all MAPLE variables. It is important to do this whenever you start a new MAPLE project.
Now resize your MAPLE and Internet Explorer windows so that you can see them both, side-by-side. Click in either window to make it the active window.
Your screen should look something like the figure at the right.
II. Data Points
First, carefully work through this module using the sample peak and valley points already entered in the Maple worksheet. Then, use your recorded peak and valley data points collected from Colossus (Module A, page 2).
Enter the x coordinates of your peak point and valley point using the list syntax ( [x1,x2] ) for the xdata variable.
Enter the y coordinates of your peak point and valley point using the list syntax ( [y1,y2] )for the ydata variable.
Enter the slope conditions for your peak point and for your valley point using the list syntax ( [s1,s2] ) for the slopes variable.
III. Connecting Cubic Polynomial
Now that you have entered the x coordinates, y coordinates, and slope conditions, you can work through the Maple worksheet by pressing the Enter key on your computer to execute the Maple commands.
In this section, the Maple commands will determine a cubic polynomial that fits the given peak and valley points. A close examination of the commands shows that Maple determines the unknown coefficients by solving a system of 4 equations [two conditions at each of the two (peak and valley) points] in 4 unknowns.
Maple shows a plot of the cubic polynomial function. Does this match your coaster hill?
IV. Calculation of the Angle of Steepest Descent
Now we must determine the steepest point on the curve (i.e., the coaster drop). In other words, we must determine the minimum value of the derivative on the x interval (determined by the peak and valley points). In order to work with a positive-valued function, we rephrase this as determining the maximum value of the absolute value of the derivative on the x interval.
How do we maximize |f'| on a closed interval? We determine critical points of f' and then compare function values of f' at critical points and endpoints. The Maple commands calculate and then graph f'(x). Then, the critical points of f' are found by solving f"(x) = 0 on the restricted x interval. Finally, we evaluate f'(x) at all critical points and endpoints and choose the maximum absolute value.
Questions:
-
What is the x coordinate of the point of steepest descent?
-
What is the relation between the point of steepest descent and the peak and valley points?
-
Is this relation true for all functions?
-
How does the slope at the steepest point compare to your previous work from module A?
To determine the angle of steepest descent, we must convert slope measurement into angle measurement. Using a right triangle, we see that the radian measure of the angle of steepest descent is given by the arctangent of the slope.
V. Safety Restrictions and Thrill Factor
In this section, we determine safety of the coaster based on the radian measure of the angle of steepest descent. We also calculate the thrill of the drop based on the definition (see page 1 or page 2).
VI. Observation and Generalization
Repeat using collected data points (from Module A, page 2) for the single drop of the Steel Dragon.
Keeping in mind the coaster restrictions, experiment with several different peak and valley combinations. Keep a record of your results.
Design of a Thrilling Roller Coaster - Module D. Design of a Coaster: Trig Functions
In this module, you will model a straight-stretch coaster (several hills) by marking peak and valley points and then fitting (in height and slope) a trig function to each consecutive pair of marked points. Once you have determined the functions, you will then calculate the thrill of the coaster. We provide a downloadable Maple worksheet with commands and explanations.
I. Getting Started
![]() Click the button at the right to open the MAPLE worksheet trigcoasters.mws. If you are given a choice, you should save the file to your hard drive, then navigate to your hard drive and open the file from there. In the MAPLE worksheet, position your cursor anywhere in the line [ > restart: and press Enter. Pressing the Enter key executes the MAPLE code on the current line. The MAPLE restart command will clear all MAPLE variables. It is important to do this whenever you start a new MAPLE project.
Click the button at the right to open the MAPLE worksheet trigcoasters.mws. If you are given a choice, you should save the file to your hard drive, then navigate to your hard drive and open the file from there. In the MAPLE worksheet, position your cursor anywhere in the line [ > restart: and press Enter. Pressing the Enter key executes the MAPLE code on the current line. The MAPLE restart command will clear all MAPLE variables. It is important to do this whenever you start a new MAPLE project.
Now resize your MAPLE and Internet Explorer windows so that you can see them both, side-by-side. Click in either window to make it the active window.
Your screen should look something like the figure at the right.
II. Data Points
First, carefully work through this module using the sample peak and valley points already entered in the Maple worksheet. Then, use your recorded peak and valley data points collected from the Greyhound (Module A, page 2).
Enter the x coordinates of your n peak and valley points using the list syntax ( [x1,x2,...,xn] ) for the xdata variable.
Enter the y coordinates of your n peak and valley points using the list syntax ( [y1,y2,...,yn] )for the ydata variable.
Enter the slope conditions for your n peak and valley points using the list syntax ( [s1,s2,...,sn] ) for the slopes variable.
III. Connecting Trig Functions
Now that you have entered the x coordinates, y coordinates, and slope conditions, you can work through the Maple worksheet by pressing the Enter key on your computer to execute the Maple commands.
In this section, the Maple commands will determine a trig function of the form
f(x) = a cos(bx + c) + d
that fits each successive pair of peak/valley points. A close examination of the commands shows that Maple determines the unknown coefficients for each function by solving a system of 4 equations [two conditions at each of the two (peak and valley) points] in 4 unknowns.
Maple shows a plot of the trig functions. Does this match your coaster path?
IV. Calculation of the Angles of Steepest Descent/Ascent
Now we must determine the steepest point on the rise and fall of each coaster hill. We use what we learned in section VI of Module B (page 3), namely, that for these functions the x-coordinate of the point of steepest descent/ascent is the x-coordinate of the midpoint between peak and valley points. This observation will shorten our mathematical calculations.
V. Safety Restrictions and Thrill Factor
In this section, we determine safety of the coaster based on the radian measure of the angle of steepest descent. We also calculate the thrill of each drop and of the coaster, based on the definition (see page 1 or page 2).
 |
|
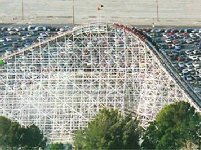
Shivering Timbers |
VI. Assignment - Coaster Design
Repeat this assignment using your recorded peak and valley data points from several hills of The Devil (from Module A, page 2).
Repeat this assignment using your recorded peak and valley data points from several hills of Shivering Timbers (from Module A, page 2).
Keeping in mind the coaster restrictions, experiment with several different peak and valley combinations. Keep a record of your results.
Design of a Thrilling Roller Coaster - Module E. Design of a Coaster: Cubic Functions
In this module, you will model a straight-stretch coaster (several hills) by marking n peak and valley points and then fitting (in height and slope) n - 1 cubic polynomial functions, one to each consecutive pair of marked points. Once you have determined the functions, you will then calculate the thrill of the coaster. We provide a downloadable Maple worksheet with commands and explanations.
I. Getting Started
![]() Click the button at the right to open the MAPLE worksheet cubiccoasters.mws. If you are given a choice, you should save the file to your hard drive, then navigate to your hard drive and open the file from there. In the MAPLE worksheet, position your cursor anywhere in the line [ > restart: and press Enter. Pressing the Enter key executes the MAPLE code on the current line. The MAPLE restart command will clear all MAPLE variables. It is important to do this whenever you start a new MAPLE project.
Click the button at the right to open the MAPLE worksheet cubiccoasters.mws. If you are given a choice, you should save the file to your hard drive, then navigate to your hard drive and open the file from there. In the MAPLE worksheet, position your cursor anywhere in the line [ > restart: and press Enter. Pressing the Enter key executes the MAPLE code on the current line. The MAPLE restart command will clear all MAPLE variables. It is important to do this whenever you start a new MAPLE project.
Now resize your MAPLE and Internet Explorer windows so that you can see them both, side-by-side. Click in either window to make it the active window.
Your screen should look something like the figure at the right.
II. Data Points
First, carefully work through this module using the sample peak and valley points already entered in the Maple worksheet. Then, use your recorded peak and valley data points collected from the Greyhound (Module A, page 2).
Enter the x coordinates of your n peak and valley points using the list syntax ( [x1,x2,...,xn] ) for the xdata variable.
Enter the y coordinates of your n peak and valley points using the list syntax ( [y1,y2,...,yn] )for the ydata variable.
Enter the slope conditions for your n peak and valley points using the list syntax ( [s1,s2,...,sn] ) for the slopes variable.
III. Connecting Cubic Polynomial Functions
Now that you have entered the x coordinates, y coordinates, and slope conditions, you can work through the Maple worksheet by pressing the Enter key on your computer to execute the Maple commands.
In this section, the Maple commands will determine a cubic polynomial functionthat fits each successive pair of peak/valley points. A close examination of the commands shows that Maple determines the unknown coefficients for each polynomial function by solving a system of 4 equations [two conditions at each of the two (peak and valley) points] in 4 unknowns.
Maple shows a plot of the trig functions. Does this match your coaster path?
IV. Calculation of the Angles of Steepest Descent/Ascent
Now we must determine the steepest point on the rise and fall of each coaster hill. We use what we learned in section VI of Module C (page 4), namely, that for these functions the x-coordinate of the point of steepest descent/ascent is the x-coordinate of the midpoint between peak and valley points. This observation will shorten our mathematical calculations.
V. Safety Restrictions and Thrill Factor
In this section, we determine safety of the coaster based on the radian measure of the angle of steepest descent. We also calculate the thrill of each drop and of the coaster, based on the definition (see page 1 or page 2).
VI. Assignment - Coaster Design
Repeat this assignment using your recorded peak and valley data points from several hills of The Devil (from Module A, page 2).
Repeat this assignment using your recorded peak and valley data points from several hills of Shivering Timbers (from Module A, page 2).
Keeping in mind the coaster restrictions, experiment with several different peak and valley combinations. Keep a record of your results.
Design of a Thrilling Roller Coaster - Project: Design the Most Thrilling Coaster
Here you will use the ideas from modules A-E to design a straight-stretch coaster that satisfies all restrictions and has the maximum possible thrill. Completion of this project requires ingenuity, creativity, and extension/modification of many of the ideas and Maple commands presented in modules A-E. You may use trig functions or polynomial functions or both or neither.

Greyhound, Green Bay, WI
You should write your project report as a mini technical report, and you should include:
- Complete explanation of the design of your coaster (why did you choose this particular design and how do you know it is the most thrilling?)
- Complete explanation of all mathematical calculations (slopes, angles, thrills, etc.)
- Complete Maple worksheets that show all mathematical calculations and plots.
If you have successfully completed sections A-E, you may choose to complete this project using more advanced and efficient Maple code (e.g., do loops).
![]() Click on the icon at the right to download a sample advanced Maple worksheet.
Click on the icon at the right to download a sample advanced Maple worksheet.

Steel Dragon 2000, Nagashima, Japan