Classroom-Ready Data Sets in Environmental Math
Recent national education standards advocate developing students' quantitative reasoning skills through analysis of data. For example, the National Council of Teachers of Mathematics states that "instructional programs should enable all students to formulate questions that can be addressed with data and collect, organize, and display relevant data to answer them" (NCTM, 2000). In similar fashion, the Mathematical Association of America's Curriculum Foundations Project suggests that the mathematics curriculum should "Integrate data analysis, statistics and probability into first and second year courses" (MAA Curriculum Foundations Project, 2003).
 |
|
Human-induced CO2 increase superimposed upon normal |
  |
|
Sources for photos: EPA Newsroom Gallery |
All educators have heard or read that they can find data on the Internet. At face value, this might be true. But if you need, for example, a small data set for a lecture on exponential growth, or a longer, multivariable data set just right for a statistics project, then your search time can easily stretch into many hours. Furthermore, when you find that particular data set, you might have to download a file in a special format or spend another hour reentering the numbers into your data-processing software. Similar challenges and time sinks are also encountered when searching for data in printed literature.
Greg Langkamp and Joe Hull are in the Division of Science and Mathematics at Seattle Central Community College . Greg is a mathematician and Joe is a geologist.
In 2000, with the support of the National Science Foundation, we launched the Quantitative Environmental Learning Project (QELP, pronounced "kelp") to develop environmental mathematics materials. One of the products of QELP is a web site featuring many data sets focused on environmental themes, with enough topical breadth to intrigue educators and students with diverse backgrounds. The QELP web site helps address the need for classroom-ready data sets that are easily accessible. In this article, we describe the general features of this web site and provide a few examples of how data sets can be used in the classroom. To go directly to the QELP web site, click here.
Note: This article contains many links to external sites, ours and others. Each such link will open a new browser window so you can easily switch between the text and the page under discussion. You may want to close those extra windows as you finish with them.
Why did we choose the environment as a theme? Environmental issues and problems are both topical -- take a quick glance at any mass medium -- and global; therefore they are relevant to a broad range of students. Environmental science is diverse, touching on all fields in the natural and physical sciences and many fields in the social sciences and humanities. Mathematics pervades all aspects of environmental science, providing a rich milieu for applied mathematics at any academic level.
We've integrated liberal arts mathematics and introductory environmental science in a course titled 6 Billion People and Counting. This course explores environmental issues such as human population, hazardous waste, and water pollution, and it investigates these concerns with elementary college-level mathematics. The marriage of mathematics and environmental issues and problems has been both very successful and very popular.
Published October, 2003
© 2003 by Greg Langkamp and Joe Hull
Classroom-Ready Data Sets in Environmental Math - Introduction
Recent national education standards advocate developing students' quantitative reasoning skills through analysis of data. For example, the National Council of Teachers of Mathematics states that "instructional programs should enable all students to formulate questions that can be addressed with data and collect, organize, and display relevant data to answer them" (NCTM, 2000). In similar fashion, the Mathematical Association of America's Curriculum Foundations Project suggests that the mathematics curriculum should "Integrate data analysis, statistics and probability into first and second year courses" (MAA Curriculum Foundations Project, 2003).
|
|
|
Human-induced CO2 increase superimposed upon normal |
|
|
|
Sources for photos: EPA Newsroom Gallery |
All educators have heard or read that they can find data on the Internet. At face value, this might be true. But if you need, for example, a small data set for a lecture on exponential growth, or a longer, multivariable data set just right for a statistics project, then your search time can easily stretch into many hours. Furthermore, when you find that particular data set, you might have to download a file in a special format or spend another hour reentering the numbers into your data-processing software. Similar challenges and time sinks are also encountered when searching for data in printed literature.
Greg Langkamp and Joe Hull are in the Division of Science and Mathematics at Seattle Central Community College . Greg is a mathematician and Joe is a geologist.
In 2000, with the support of the National Science Foundation, we launched the Quantitative Environmental Learning Project (QELP, pronounced "kelp") to develop environmental mathematics materials. One of the products of QELP is a web site featuring many data sets focused on environmental themes, with enough topical breadth to intrigue educators and students with diverse backgrounds. The QELP web site helps address the need for classroom-ready data sets that are easily accessible. In this article, we describe the general features of this web site and provide a few examples of how data sets can be used in the classroom. To go directly to the QELP web site, click here.
Note: This article contains many links to external sites, ours and others. Each such link will open a new browser window so you can easily switch between the text and the page under discussion. You may want to close those extra windows as you finish with them.
Why did we choose the environment as a theme? Environmental issues and problems are both topical -- take a quick glance at any mass medium -- and global; therefore they are relevant to a broad range of students. Environmental science is diverse, touching on all fields in the natural and physical sciences and many fields in the social sciences and humanities. Mathematics pervades all aspects of environmental science, providing a rich milieu for applied mathematics at any academic level.
We've integrated liberal arts mathematics and introductory environmental science in a course titled 6 Billion People and Counting. This course explores environmental issues such as human population, hazardous waste, and water pollution, and it investigates these concerns with elementary college-level mathematics. The marriage of mathematics and environmental issues and problems has been both very successful and very popular.
Published October, 2003
© 2003 by Greg Langkamp and Joe Hull
Classroom-Ready Data Sets in Environmental Math - The QELP Web Site
Classroom-Ready Data Sets in Environmental Math - Investigating Data in the Classroom: Short Example
Within the background information provided for each data set, we suggest a few questions that one might ask about the data. But we've left these suggestions to a minimum because we anticipate that educators will use the data sets in many different ways. In this sense, the QELP data set collection is simply a resource, not a suggested or prescribed curriculum. That said, you may want a better understanding of how we and others use data sets in the classroom. We provide some short examples here and longer ones in the next two pages.
We often use data sets in lectures or discussions or in simple homework problems. Here are a few short questions that you might pose to students in quantitative reasoning, statistics, or precalculus courses. Use WebStat to work online, or download the data sets to the technology of your choice.
|
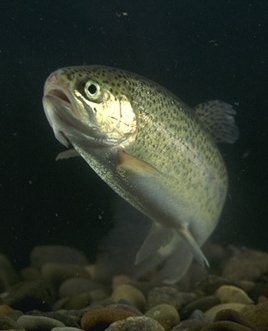 |
| Source: Ken Hammond, USDA |
Classroom-Ready Data Sets in Environmental Math - An Extended Problem
Data sets can also serve as the basis for more involved student assignments, including extended homework problems and full-day classroom activities. Here is a problem that can be used in a precalculus and trigonometry course. The data analysis can be done using WebStat, a graphing calculator, or spreadsheet software.
Atmospheric Carbon Dioxide at the Mauna Loa Observatory, 1974-1985
|
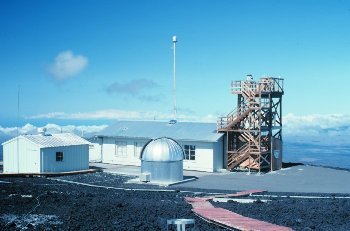 The Mauna Loa Observatory with view of the dome housing Dobson ozone spectrophotometer and air intake tower for atmospheric constituent measurements. Source: NOAA Photo Library |
-
Estimate the period and amplitude of the de-trended data. Then describe the de-trended data with either a sine or cosine function.
-
Make a plot of the residuals (i.e. differences) between the de-trended data and your trigonometric function found in part 4. Are the de-trended data perfectly sinusoidal? Explain.
-
Determine a function that describes the original data set (before de-trending).
- Read the background information on the Mauna Loa CO2 data (see About the Data). Describe how the data would be different if the Mauna Loa observatory were located in the southern hemisphere. How could you modify your functions from parts 4 and 6 so that they would fit southern hemisphere data?
Classroom-Ready Data Sets in Environmental Math - A Student Project
Multi-day projects involving real data allow students to investigate applied topics in depth. By incorporating many facets of data analysis (evaluating data validity, identifying outliers, describing patterns, drawing conclusions, etc.), projects help students develop both basic quantitative skills and higher-level critical thinking abilities.
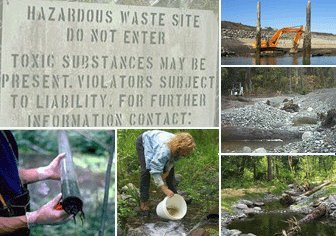 One of the extended projects that we use in our interdisciplinary mathematics and environmental science course links the mathematics of normal distributions with the science of hazardous waste. Students are presented with hazardous waste production data from the U.S. Environmental Protection Agency's Biennial Reporting System, the only nationwide, uniform database on hazardous waste generation and management. Hazardous materials, such as lead and toluene, are categorized and monitored under the Resource Conservation and Recovery Act (RCRA). See Background Information on Hazardous Waste.
Data for the hazardous waste project can be found at the QELP web site as Data Set #003, a compilation from 12 states for the years 1989-1997. In our course, we prefer that each group work with a different data set, and so the compiled data are broken down by state. The state-by-state data (in Excel format only) are found in the About the Data section of Data Set #003. We present each group with a data sheet (click here to see the data sheet for Illinois) that lists county population and biennial RCRA data. Our students use a graphing calculator (the TI-83 Plus), so we download the data to their calculators. For courses using spreadsheet or statistical software, we recommend that students download state data directly from the QELP web site, and then create and print their own data sheets.
In the project, we first ask students to note any unusually large changes in RCRA waste production from biennium to biennium. RCRA waste production in each county often varies over several orders of magnitude. Students calculate the mean RCRA waste production over an 8-year period for each of the counties and observe that the county mean RCRA values are fairly skewed. Students progressively work toward obtaining normally distributed data by computing per capita waste production and then transforming the per capita data using logarithms. Students are also questioned about a proposed enforcement/regulatory scheme ("carrots and sticks"). The enforcement rubric creates a utilitarian aspect to the mathematical analysis at several steps in the project. Students generate increasingly more sophisticated punishment and reward schemes, including one based on z-scores.
A slightly condensed version of the project can be viewed here: Hazardous Waste Project (HTML). The complete project, with background information and state data sheets, can be downloaded as a Word document here: Hazardous Waste Project (Word).
Source for photos on this page: EPA Cleanup Enforcement Site
Classroom-Ready Data Sets in Environmental Math - Concluding Remarks
We believe that our web-based collection of data sets gives educators a valuable classroom resource for developing and teaching courses that involve data investigation and analysis, whether in an interdisciplinary setting or not. Verbal and written feedback from educators supports this -- many use the data sets for class examples, homework, and projects, in manners similar to our own. One user recently wrote, "I’m glad I found [your site]. Good data are hard to find." Numerical evidence in the form of visitor hits also tells us that the web site is serving the educational community: Site hits from high schools and colleges (presumably students and teachers) currently number about 100 per week and are steadily growing.
Although our NSF funding has ended, we will continue to develop environmental mathematics materials for QELP. We're working on a preliminary draft of a liberal arts mathematics text with an environmental theme, which will include many exercises similar to the hazardous waste project on the preceding page. See the New Book page at our web site for more information. We'll also be posting additional data sets to the QELP collection. Our goal is complete coverage of the mathematics and environmental science topics that we list. To this end, if you have appropriate environmental data sets to share, please contact us! We'll be glad to format the files and get them posted.
Classroom-Ready Data Sets in Environmental Math - References
MAA Curriculum Foundations Project: /features/currfound.html (accessed September 26, 2003).
Miller, G. T. (2002). Sustaining the Earth, 6th Ed. Belmont, CA: Brooks/Cole Publishers. See http://www.brookscole.com/biology_d/, and go to Environmental Science (accessed September 26, 2003).
National Council of Teachers of Mathematics (2000). Principles and Standards for School Mathematics. Chapter 7. Reston, VA: The Council. Full text available online at http://standards.nctm.org, Chapter 7 at http://standards.nctm.org/document/chapter7/index.htm (both accessed September 26, 2003).
West, R. W., and R. T. Ogden (1997). Statistical Analysis with WebStat, a Java Applet for the World Wide Web. Journal of Statistical Software, Vol. 2:3. Article available online at http://www.jstatsoft.org/v02/i03/webstat.pdf (accessed September 26, 2003).